


1. Introduction
2. Materials and Methods
2.1. Experimental animals and experimental design
2.2. Feeding management and digestibility trial
2.3. Feed sampling and chemical analysis
2.4. Calculations and statistical analysis
3. Results and Discussion
3.1. Feed composition, feed intake, and growth performance
3.2. Nutrient digestibility
3.3. Economic evaluation
3.4. Integrated discussion and study limitations
4. Conclusion
1. Introduction
Beef cattle production plays a fundamental role in global food security by providing high-quality animal protein, supporting rural livelihoods, and contributing to agricultural economies. The increasing global demand for animal-derived foods, driven by population growth, urbanization, and economic development, continues to stimulate the need for efficient and sustainable beef production systems [1]. However, future increases in beef production must rely primarily on improvements in productivity, feed efficiency, and resource-use efficiency rather than expansion of livestock numbers [2,3]. Therefore, improving nutritional management through precision feeding and balanced diets has become a major strategy for sustainable livestock production.
Mongolia has one of the world's largest extensive livestock production systems, where livestock farming contributes substantially to national food security, employment, and rural livelihoods. However, Mongolian livestock production remains highly dependent on natural pasture resources, which are strongly influenced by seasonal climatic variations. The prolonged winter period, low temperatures, and reduced forage availability frequently create severe nutritional challenges for livestock, particularly during the winter and early spring seasons.
During these critical periods, available pasture resources often fail to meet the nutritional requirements of growing beef cattle due to insufficient metabolizable energy, crude protein, and mineral supply. Inadequate nutrient intake reduces rumen microbial activity, decreases fiber degradation, limits nutrient absorption, and ultimately results in reduced average daily gain and prolonged fattening periods [4]. Therefore, developing feeding strategies that provide balanced nutrients according to animal requirements is essential for improving beef production efficiency under Mongolian conditions.
Cultivated green forage represents an important locally available feed resource because it can provide effective fiber, crude protein, minerals, and fermentable substrate required to support rumen function. However, forage-based diets may not consistently supply sufficient metabolizable energy and protein for rapidly growing cattle, particularly when forage availability or quality is restricted. Balanced supplementation with cereal grains and protein sources can improve the supply and synchronization of nutrients available for microbial fermentation and tissue accretion [4,5,6,7].
Previous studies have shown that strategic supplementation can improve growth performance, nutrient intake, and nutrient utilization in grazing and forage-based beef systems, although the magnitude and direction of responses depend on forage quality, supplement composition, supplementation strategy, and management conditions [8,9,10].
Selenge cattle are adapted to Mongolian production conditions and represent an important local beef resource. Developing complete feeds from domestic grains, protein sources, and mineral ingredients may improve the consistency of nutrient supply during winter and reduce dependence on purchased feed inputs.
Therefore, this study evaluated three locally formulated complete compound feeds, differing mainly in corn and rapeseed-cake inclusion, when supplied with the recorded amounts of cultivated green forage. Feed intake, apparent nutrient digestibility, growth performance, and a provisional feed margin were compared with pasture grazing and conventional farm feeding.
The working hypothesis was that supplementation with a nutritionally balanced complete feed would improve nutrient utilization and growth performance relative to conventional winter feeding. Because the recorded quantities were 6 kg/day green forage and 3 kg/day complete feed, the study does not infer a 60:40 dietary ratio from these as-fed quantities.
2. Materials and Methods
2.1. Experimental animals and experimental design
The feeding experiment was conducted during the winter season of 2025 at the “Duyaa Mineral” LLC farm in Nalaikh District, Ulaanbaatar, Mongolia. The study was conducted under the farm’s winter-feeding conditions for growing Selenge cattle.
Twenty-five healthy male Selenge cattle, approximately 18 months of age, were enrolled. Corrected initial body weights ranged from 282.56 to 283.08 kg. Following a 14-day adaptation period, animals were randomly allocated to five treatment groups (n = 5 per group) in a completely randomized design. The individual animal was the experimental unit for statistical analysis.
The experimental dietary treatments were as follows:
Control group 1 (C1): cattle were maintained on natural pasture without supplementary feed.
Control group 2 (C2): cattle received the conventional farm feeding system (6 kg/day green forage and 3 kg/day wheat bran).
Experimental group 1 (E1): cattle received 6 kg/day green forage and 3 kg/day CF1.
Experimental group 2 (E2): cattle received 6 kg/day green forage and 3 kg/day CF2.
Experimental group 3 (E3): cattle received 6 kg/day green forage and 3 kg/day CF3.
The three complete compound feeds were formulated from locally available ingredients and differed primarily in corn and rapeseed-cake inclusion (Table 1). Their ingredient compositions are reported on an as-formulated basis.
The ingredient composition of the experimental complete compound feeds. Table 1.
Table 1.
Ingredient composition of complete compound feeds (%)
| No. | Ingredient | CF1 | CF2 | CF3 |
| 1 | Wheat | 35 | 35 | 35 |
| 2 | Wheat bran | 15 | 15 | 15 |
| 3 | Barley | 25 | 25 | 25 |
| 4 | Corn | 12 | 14 | 16 |
| 5 | Rapeseed cake | 10 | 8 | 6 |
| 6 | Zeolite | 2 | 2 | 2 |
| 7 | Salt | 1 | 1 | 1 |
2.2. Feeding management and digestibility trial
The feeding period lasted 60 days. Animals in C2 and E1–E3 were individually fed twice daily, in the morning and afternoon, and had free access to clean drinking water. Feed offered and refusals were recorded for each animal, and refusals were collected and weighed daily. Intake percentage was calculated as [(feed offered − feed refused) / feed offered] × 100. C1 animals remained under pasture-grazing management and therefore served as a contextual pasture reference rather than a diet-controlled treatment. This distinction is considered explicitly in the interpretation of treatment effects.
C1 cattle were maintained under pasture-grazing conditions without supplemental feed, whereas C2 received the conventional farm ration.
As shown in Table 2, For E1–E3, the recorded daily amounts were 6 kg green forage and 3 kg complete compound feed. These quantities are reported exactly as recorded and are not converted to a 60:40 dietary ratio because the as-fed mass ratio was 2:1.
Table 2.
Feeding treatments for growing Selenge cattle
| Group | No. of cattle |
Green forage (kg) |
Wheat bran (kg) |
Complete compound feed (kg) | Pasture |
| C1 | 5 | - | - | - | Pasture grazing |
| C2 | 5 | 6 | 3 | - | - |
| E1 | 5 | 6 | - | 3 (CF1) | - |
| E2 | 5 | 6 | - | 3 (CF2) | - |
| E3 | 5 | 6 | - | 3 (CF3) | - |
2.3. Feed sampling and chemical analysis
Samples of feed ingredients, feed refusals, and feces were collected during the experimental period. Samples were dried, ground, and passed through a 1.5-mm sieve using a Wiley mill (Model 4, Thomas Scientific, Swedesboro, NJ, USA) before laboratory analysis.
Dry matter, crude protein, crude fat, and ash were determined according to official AOAC methods [11]. Neutral detergent fiber (NDF) and acid detergent fiber (ADF) were determined according to Van Soest et al. [12] using an ANKOM200 Fiber Analyzer (ANKOM Technology Corporation, Macedon, NY, USA). NDF was analyzed without α-amylase treatment and expressed on an ash-free basis.
Apparent total-tract digestibility was determined by quantitative total fecal collection rather than by an indigestible marker. Feces were collected at each defecation event; the total fecal output of each animal was weighed daily, and a representative aliquot was taken from each collection event. Aliquots from each animal were combined to form a daily composite sample for laboratory analysis. Total-collection procedures provide a direct estimate of fecal nutrient output, whereas marker-based approaches estimate fecal output indirectly [13,14]. The exact duration of the fecal-collection period was not recorded in the supplied experimental records and is therefore not stated. Apparent digestibility was calculated as [(nutrient intake − fecal nutrient output) / nutrient intake] × 100.
Organic matter digestibility and metabolizable energy values were estimated using feed-evaluation equations reported for Mongolian livestock feed resources [15]. All feed and fecal analyses were performed at the Feed Evaluation Laboratory, School of Animal Science and Biotechnology, Mongolian University of Life Sciences.
2.4. Calculations and statistical analysis
Feed intake, live body-weight change, average daily gain (ADG), relative weight gain, and provisional feed margin were calculated from the recorded animal-level observations and feed-cost records.
Average daily gain (ADG) was calculated as (final live weight − initial live weight) / 60 days.
Corrected growth variables are presented as mean ± SD (n = 5). Relative weight gain was calculated as [(final live weight − initial live weight) / initial live weight] × 100. Feed-intake percentages and corrected digestibility means are reported as supplied; no SD or SEM values were available for those datasets.
Economic evaluation was based on feed offered over the 60 days (360 kg green forage plus 180 kg supplemental feed) because the supplied economic records used offered quantities. An assigned value of 25,000 MNT/kg was applied to incremental live-weight gain. Provisional feed margin was calculated as (live-weight gain × 25,000 MNT/kg) − feed cost. This is a partial feed-margin measure because labor, housing, veterinary, transport, pasture, and other non-feed costs were not included.
Statistical analysis was performed using IBM SPSS Statistics. The individual animal was the experimental unit, treatment was the fixed factor, and treatment effects were evaluated using a one-way analysis of variance (ANOVA) under the model Yij = μ + Ti + εij, where Yij is the response of animal j receiving treatment i, μ is the overall mean, Ti is the fixed treatment effect, and εij is the residual error. Pairwise comparisons were performed using Tukey’s HSD; the supplied analysis also indicates that an LSD post-hoc procedure was run. Statistical significance was defined as P < 0.05. The available records did not contain numerical outputs for normality or homogeneity-of-variance tests; therefore, no unverified test statistics or P-values are reported.
Animal ethics approval:
3. Results and Discussion
3.1. Feed composition, feed intake, and growth performance
The chemical composition of the complete compound feeds and green forage is in Table 3. Crude protein (CP) concentration of the complete feeds ranged from 19.35 to 21.65%, and NDF ranged from 38.20 to 46.12% on a dry-matter basis. CF1 had the highest CP concentration (21.65%), whereas CF2 had the highest NDF concentration (46.12%). Green forage contained 14.33% CP and 63.18% NDF.
Table 3.
Chemical composition of complete compound feeds and green forage (dry-matter basis, %)
Green forage contained more structural fiber than the complete feeds, as expected for a forage-based basal feed. Mineral concentrations are presented descriptively because no inferential analysis of mineral composition was supplied.
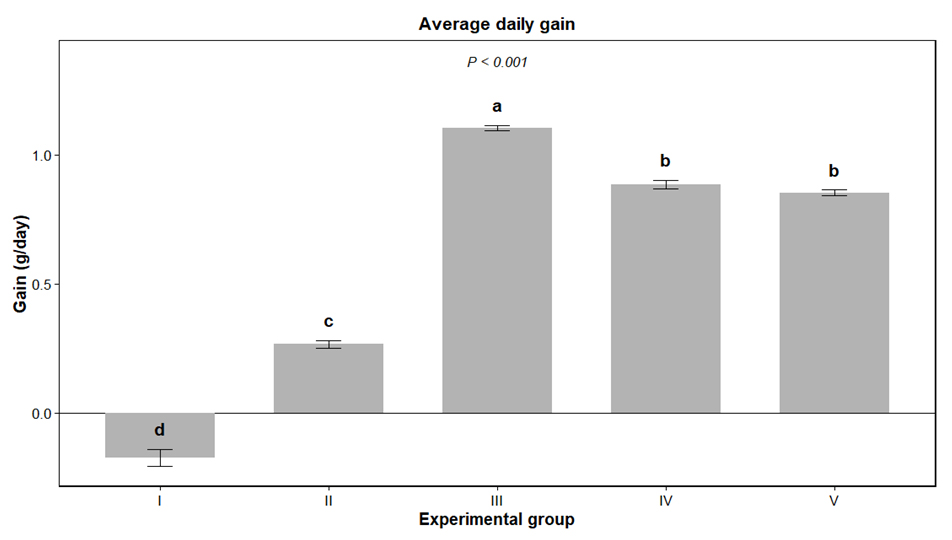
Feed intake and growth performance are summarized in Table 4. Green-forage intake was 91.05% in C2 and 95.88–96.58% in E1–E3, whereas complete-feed intake reached 100% in all experimental groups. Initial body weight was similar among groups. E1 had the greatest final body weight, absolute gain, relative gain, and ADG, followed by E2 and E3; C1 lost live weight during the 60-day period (Fig. 1).
Table 4.
Feed intake and growth performance of growing Selenge cattle
Feed-intake values are percentages of feed offered. Growth variables are mean ± SD (n = 5). Within each growth-variable column, means with different superscripts differ according to Tukey’s HSD at P < 0.05. All groups shared the same superscript for initial BW, indicating no significant baseline difference.
3.2. Nutrient digestibility
Complete-feed intake reached 100% in E1–E3. This indicates that no measurable refusal of the offered complete feed was recorded under the individual-feeding conditions. However, intake percentage should not be interpreted as a direct measure of palatability or nutrient intake without dry-matter intake and nutrient-composition data.
Apparent nutrient digestibility values. Table 5.
All four measured nutrient fractions differed among C2 and E1–E3 (P ≤ 0.002). E1 had the highest apparent digestibility of organic matter, crude protein, crude fat, and crude fiber among the tested individually fed diets. This pattern is consistent with the established dependence of digestibility on diet composition and forage-to-concentrate characteristics [9,16,25].
Table 5.
Apparent nutrient digestibility of experimental diets (%)
Organic matter digestibility was 72.395% in C2 and 86.708% in E1. Crude-protein digestibility was 70.175% in C2 and 88.525% in E1, with E2 and E3 intermediate. Crude-fat digestibility ranged from 69.250 to 71.335%, and crude-fiber digestibility ranged from 49.230 to 61.153%.
The higher digestibility observed in E1 is biologically consistent with its relatively high CP concentration and overall nutrient profile. However, CF1, CF2, and CF3 also differed in corn and rapeseed-cake inclusion; therefore, the present data do not support attributing the response to CP concentration alone. The appropriate inference is that the complete-feed formulation as a whole was associated with greater apparent nutrient utilization.
Overall, the digestibility results indicate greater apparent nutrient utilization in the complete-feed treatments than in the conventional farm ration under the conditions studied. Because SD/SEM values were not supplied for the corrected digestibility dataset, the means are presented without reconstructed dispersion estimates.
During the 60-day feeding period, C1 cattle lost 10.36 ± 1.90 kg of live weight (ADG −0.174 ± 0.034 kg/day), whereas C2 cattle gained 15.96 ± 0.85 kg (ADG 0.266 ± 0.015 kg/day). E1, E2, and E3 gained 66.19 ± 0.52, 53.22 ± 0.88, and 51.30 ± 0.53 kg, respectively. The magnitude of these differences is biologically relevant for growing cattle because growth reflects the quantity and utilization of metabolizable energy and protein available after maintenance requirements are met [4,7].
3.3. Economic evaluation
E1 achieved the highest final body weight (349.26 ± 0.96 kg), relative gain (23.38 ± 0.16%), and ADG (1.105 ± 0.011 kg/day), followed by E2 and E3. The comparison with C1 should remain contextual because grazing management was not equivalent to the individual-feeding conditions used for C2 and E1–E3.
The corrected dataset therefore demonstrates a clear growth advantage for the formulated-feed groups relative to C2 under the tested feeding conditions. Economic interpretation is presented separately below.
Economic evaluation is presented in Table 6. Feed costs were calculated from feed offered rather than feed consumed because the supplied economic records use the full 360 kg green-forage and 180 kg supplemental-feed quantities over 60 days.
Table 6.
Feed costs based on offered quantities and provisional feed margin during the 60-day feeding period
E1 had the highest provisional feed margin (1,125,550 MNT/animal), followed by E2 (812,100 MNT/animal) and E3 (778,500 MNT/animal). C2 had a slightly negative provisional feed margin (−15,000 MNT/animal). These values represent partial feed margins and should not be interpreted as whole-enterprise profitability.
The economic ranking was driven primarily by differences in live-weight gain rather than by the relatively small differences in feed cost among the formulated feeds. The 25,000 MNT/kg assumption was applied as the value of incremental live-weight gain.
Accordingly, CF1 produced the most favorable partial feed-margin outcome among the tested formulations. A complete economic assessment would require labor, housing, veterinary, transport, pasture, and other production costs.
3.4. Integrated discussion and study limitations
Feed intake is a primary determinant of the quantity of energy, protein, and other nutrients available for maintenance and tissue accretion. Voluntary intake is influenced by nutrient density, physical characteristics of the diet, meal size and frequency, and interactions between basal forage and supplemental feed [5,8].
In the present study, complete-feed intake reached 100% in E1–E3, while green-forage intake was 95.88–96.58% in the experimental groups and 91.05% in C2. These values indicate a high proportion of the offered feed was consumed under the individual-feeding conditions. Nevertheless, percentage intake should be interpreted as an offered-versus-refused measure rather than as a substitute for dry-matter or nutrient intake.
The observed intake pattern is compatible with reports showing that supplementation can alter total nutrient intake and growth of beef cattle, while the response depends strongly on forage quality and the protein and energy supplied by the supplement [8]. Differences among studies may arise from forage type, moisture content, feed processing, animal characteristics, and feeding management.
From a nutritional perspective, adequate synchrony of fermentable carbohydrate, protein, and effective fiber supports ruminal microbial activity and nutrient utilization [7,12]. Supplementation responses are therefore dependent on both the basal forage and supplement composition, and the present findings should be interpreted as formulation-specific rather than as evidence for a universally optimal forage-to-concentrate ratio.
E1 showed the highest apparent digestibility for all four measured nutrient fractions. This is consistent with evidence that diet composition and forage-to-concentrate ratio can materially affect organic-matter and crude-protein digestibility [9,16,25].
The superior digestibility of E1 is biologically consistent with its relatively high CP concentration and overall nutrient balance, but the study design does not permit separation of the effects of individual ingredients. The appropriate inference is therefore that the complete-feed formulation as a whole was associated with greater apparent nutrient utilization.
Average daily gain (ADG) is a key indicator of biological efficiency in growing beef cattle because it reflects the extent to which absorbed nutrients are converted into tissue. Growth depends on the supply and utilization of metabolizable energy, metabolizable protein, minerals, and vitamins, together with effective ruminal fermentation [4,15].
E1–E3 achieved ADG values of 0.854–1.105 kg/day, compared with 0.266 kg/day in C2, whereas C1 cattle lost 0.174 kg/day. Thus, the formulated-feed groups showed substantially greater growth than the conventional farm ration under the conditions tested.
E1 had the highest ADG (1.105 kg/day), approximately 4.2-fold the C2 value. This identifies CF1 as the strongest-performing formulation among those evaluated, although the experimental design does not isolate the effects of individual ingredients or nutrient fractions.
The magnitude of ADG should be interpreted in relation to breed, initial BW, forage quality, diet energy density, season, and management. Accordingly, comparisons with published cattle studies are informative for context but should not be treated as direct experimental contrasts [4,17].
The present response is consistent with the broader literature showing that strategic supplementation can improve growth when basal forage does not fully meet the nutrient requirements of growing cattle [6,8,18]. The size of the response in this study, however, is specific to the tested formulations and winter feeding conditions.
Compared with earlier Mongolian reports, the observed ADG was relatively high. Previously reported values were approximately 0.551 kg/day [19], 0.606 kg/day [20], 0.706 kg/day [21], and 0.778 kg/day [22]. These historical comparisons should be interpreted cautiously because animal age, genetic background, forage quality, diet composition, season, and management differed among studies.
The relatively high ADG in the present study may reflect the combined effects of diet quality, nutrient density, and the individual-feeding environment. Recent beef-cattle studies likewise show that responses to supplementation depend on the interaction between forage quality, supplemental protein and energy supply, and feeding strategy [23,24]. The higher apparent digestibility observed in E1 provides additional evidence of greater nutrient availability, but it does not establish causality for any single nutrient or ingredient [25].
Feed cost is an important component of beef production economics; therefore, biological response and input cost should be considered jointly when evaluating supplementation strategies [6,17,26].
E1 produced both the greatest live-weight gain and the highest provisional feed margin, despite having the highest feed cost among the experimental groups. E2 and E3 also produced substantially larger margins than C2 under the specified valuation and feed-cost assumptions.
The slightly negative margin for C2 indicates that the assigned value of its weight gain did not offset the feed cost calculated from offered quantities. This should not be interpreted as a net farm loss because non-feed costs and other sources of revenue were not included.
The economic advantage of E1 was therefore driven primarily by its greater live-weight gain. Economic interpretation should remain conditional on the assumed 25,000 MNT/kg value and on the use of feed offered rather than feed consumed in the supplied cost records.
A major limitation is the management confounding between C1 and the other treatments: C1 cattle grazed pasture, whereas C2 and E1–E3 were individually fed. Consequently, differences between C1 and the individually fed groups cannot be attributed to diet composition alone. The more appropriate controlled nutritional comparison is C2 versus E1–E3, although these groups also differed in ration composition. This limitation should be considered when interpreting the apparent superiority of the formulated feeds [8,23].
Overall, CF1 provided the most favorable combination of live-weight gain, apparent nutrient digestibility, and provisional feed margin among the tested formulations. The findings are promising for winter feeding of Selenge cattle but should be validated under a common management system with complete dry-matter intake records and a fully documented digestibility-collection protocol.
4. Conclusion
Under the conditions of this 60-day winter feeding trial, the recorded provision of 6 kg/day green forage plus 3 kg/day locally formulated complete feed was associated with greater growth and apparent nutrient utilization than the conventional farm ration. CF1 produced the strongest response, with a final body weight of 349.26 ± 0.96 kg, live-weight gain of 66.19 ± 0.52 kg, and ADG of 1.105 ± 0.011 kg/day.
E1 also produced the highest provisional feed margin (1,125,550 MNT/animal) when feed costs were calculated from offered quantities and 25,000 MNT/kg was assigned to incremental live-weight gain. This value is a partial feed margin rather than net farm profitability. The pasture group should be regarded as a contextual reference because grazing and individual-feeding management were confounded. Within these limitations, CF1 was the most promising of the tested formulations for winter feeding of growing Selenge cattle.

