

1. Introduction
2. Materials and Methods
2.1. Ethical statement
2.2. Animal sampling
2.3. DNA extraction and PCR amplification
2.4. PCR amplification of ASIP gene
2.5. Genotyping of ASIP Missense Mutation by PCR-RFLP
2.6. PCR Amplification and RFLP of CAST Gene
2.7. Data Analysis
2.8. Genotypic and Allele Frequencies
2.9. Hardy-Weinberg equilibrium
3. Results and Discussion
3.1. CAST Gene Polymorphism
3.2. ASIP Gene polymorphism
4. Conclusions
1. Introduction
Sheep genetic resources are of considerable importance for sustainable livestock production, particularly in regions characterized by extreme climatic conditions such as Mongolia. Mongolian sheep have evolved strong adaptability to harsh environments and represent an important source of meat, wool, and other livestock products. The identification and characterization of genetic polymorphisms associated with economically important traits are essential for improving productivity and supporting conservation-oriented breeding programs [1]. Although polymorphisms of the ASIP and CAST genes have been studied in several sheep breeds worldwide, information regarding their genetic variation in Mongolian indigenous sheep remains limited. This study is novel in simultaneously analyzing ASIP and CAST genes across a specific composition of nine Mongolian breeds, providing an opportunity to assess genetic variation related to coat color and growth traits within a single population. Coat color is a phenotypic trait of both economic and adaptive significance in sheep. The agouti signaling protein (ASIP) gene plays a central role in pigmentation by regulating melanin synthesis through antagonism of the melanocortin-1 receptor (MC1R). Expression of ASIP promotes pheomelanin production, whereas its absence or reduced activity results in eumelanin synthesis [2,3]. Studies in sheep have shown that ASIP polymorphisms are directly associated with coat color variation, making it a key candidate gene for pigmentation studies [4,5]. Meat quality, particularly tenderness, is one of the most important traits influencing consumer acceptance of lamb meat. The calpain-calpastatin proteolytic system is a major determinant of post-mortem muscle protein degradation and meat tenderization [6]. The calpastatin (CAST) gene encodes an endogenous inhibitor of calpain enzymes, and variations in this gene have been reported to affect meat tenderness, carcass characteristics, and growth traits in sheep and other livestock species [7,8]. Consequently, CAST has been widely investigated as a molecular marker for meat quality improvement. The polymerase chain reaction-restriction fragment length polymorphism (PCR-RFLP) method is a reliable and cost-effective approach for detecting single nucleotide polymorphisms in candidate genes. This technique has been extensively applied in genetic diversity and association studies of livestock species, including sheep, due to its simplicity and reproducibility [7,9]. Therefore, the aim of this study was to investigate polymorphisms of the ASIP and CAST genes in Mongolian sheep populations using PCR-RFLP and to evaluate their genetic diversity as a basis for future marker-assisted selection.
2. Materials and Methods
2.1. Ethical statement
This study was reviewed and approved by the Ethics Committee of the Mongolian University of Life Sciences (Approval number: VSBMR-2025/014) on April 15, 2025.
2.2. Animal sampling
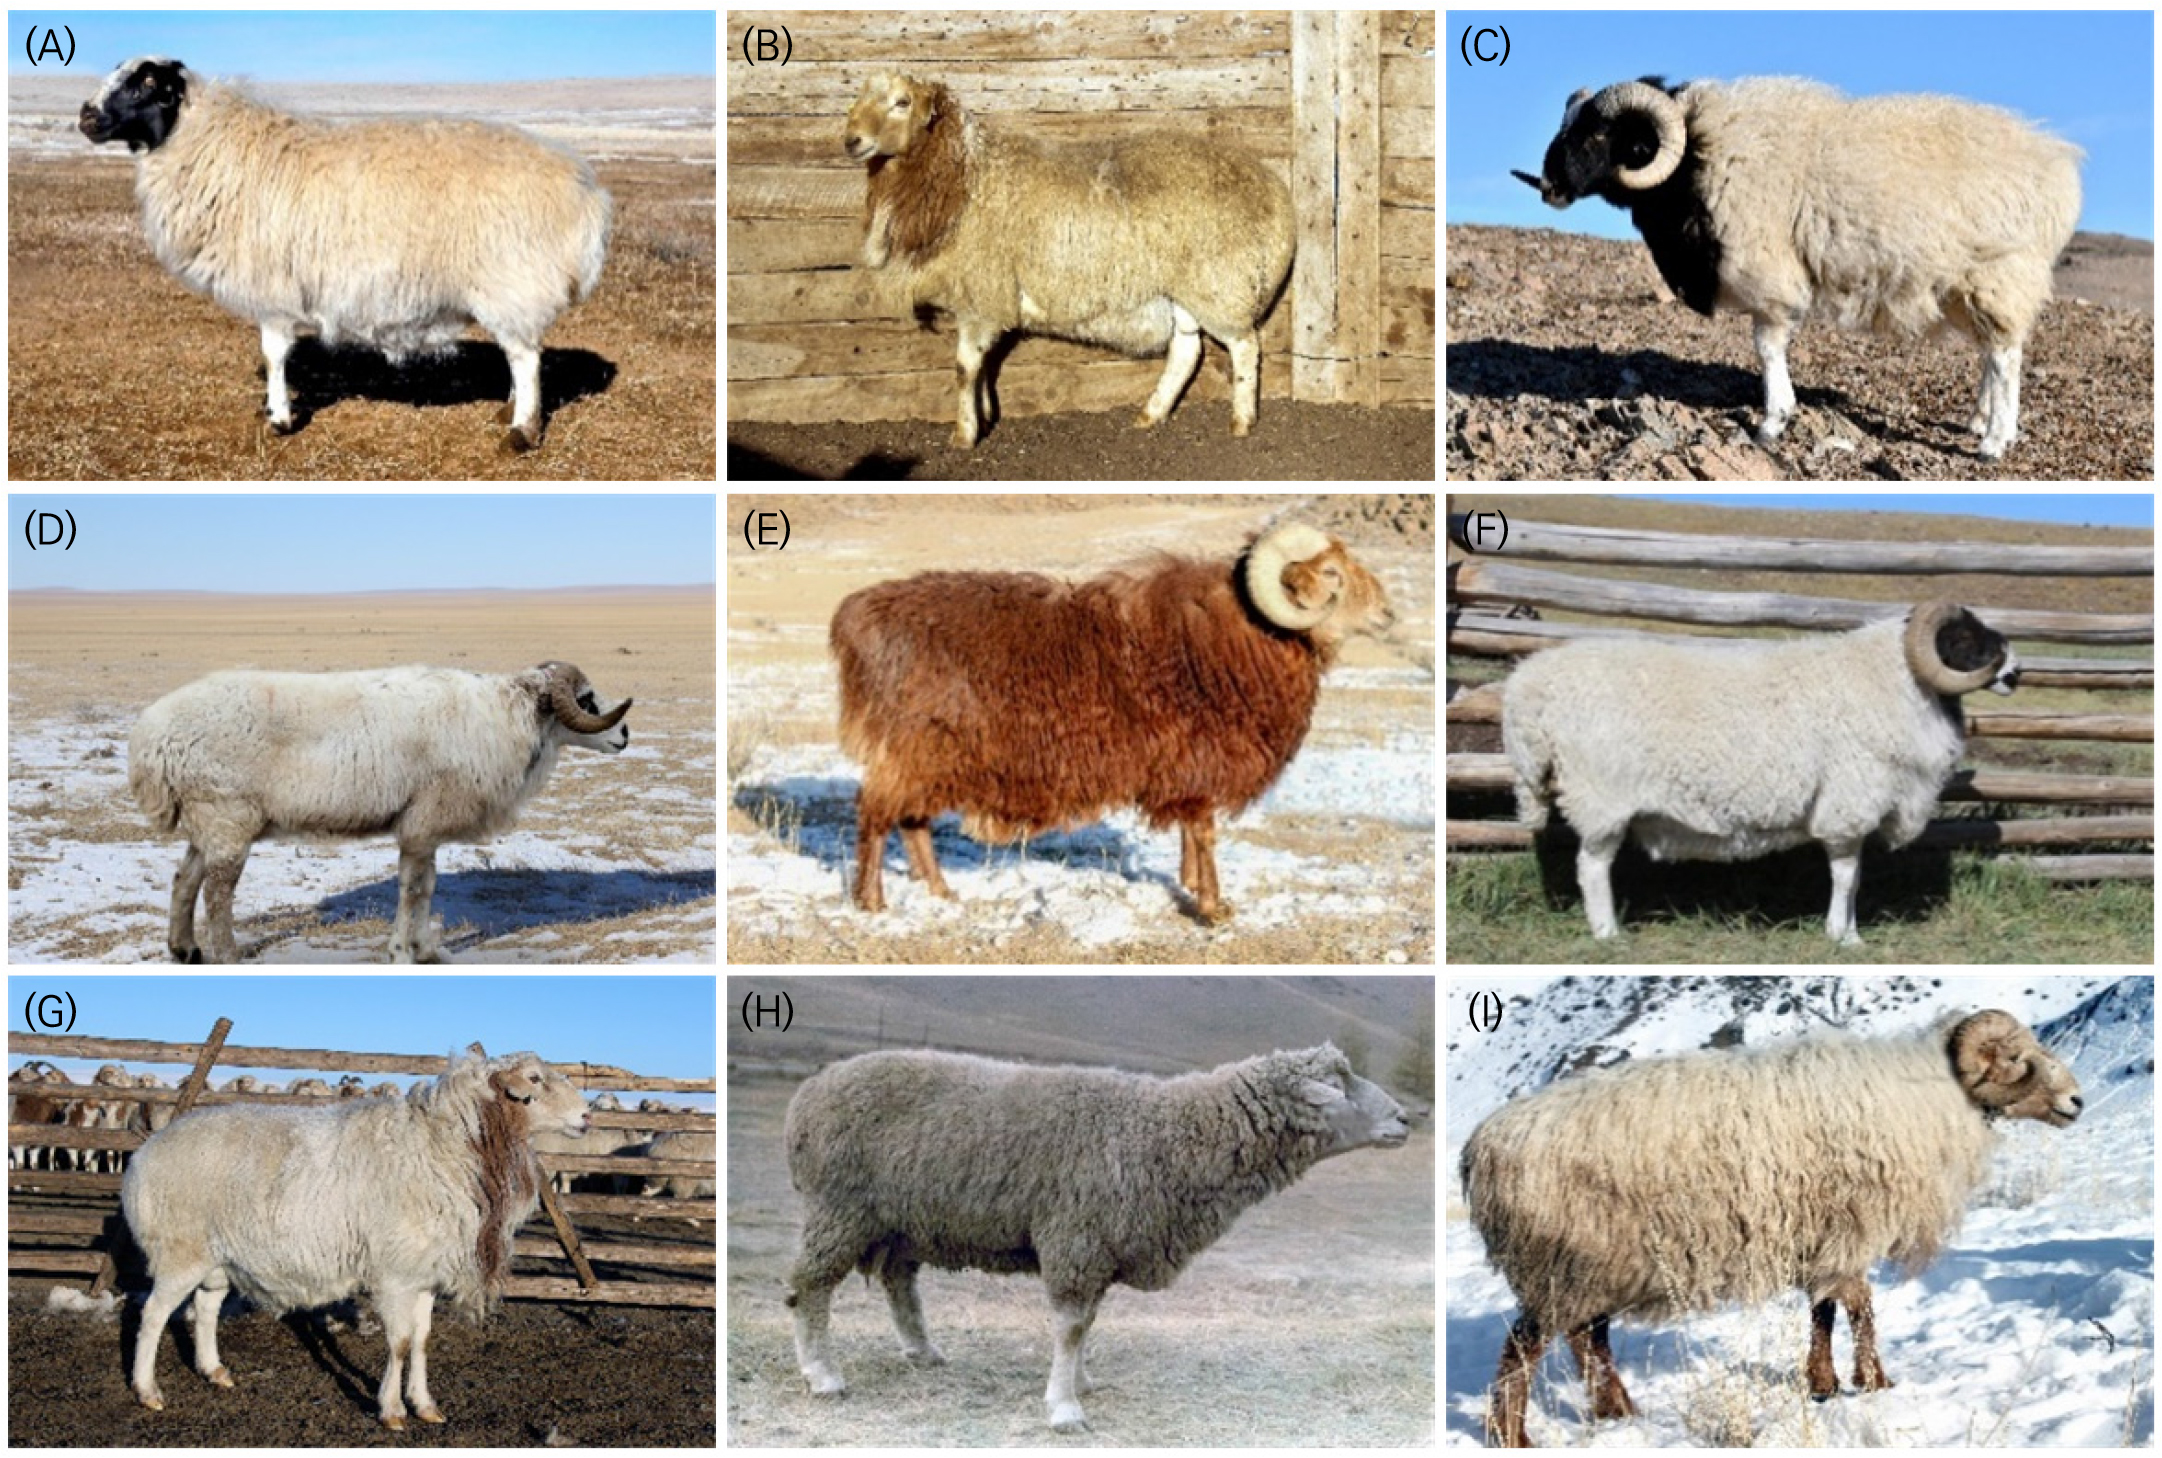
A total of 220 blood samples were collected from nine Mongolian sheep breeds (Table 1; Fig. 1 and 2). About 3 mL of blood was collected from the jugular vein into K3-EDTA tubes, labeled, transported on ice, and stored at -20°C. Final sample sizes differed due to breed availability and DNA quality: 173 samples were analyzed for ASIP and 120 for CAST. Samples failing quality control or yielding degraded DNA were excluded.
Table 1.
Sample Numbers of Mongolian Sheep Breeds
| No. | Population | Number of samples |
| 1 | Mongol | 30 |
| 2 | Uzemchin | 30 |
| 3 | Bayad | 19 |
| 4 | Tsagaan-Uul | 30 |
| 5 | Orkhon | 20 |
| 6 | Kerei | 20 |
| 7 | Torguud | 21 |
| 8 | Bureg-Khangai | 20 |
| 9 | Barga | 30 |
| Total | 220 | |
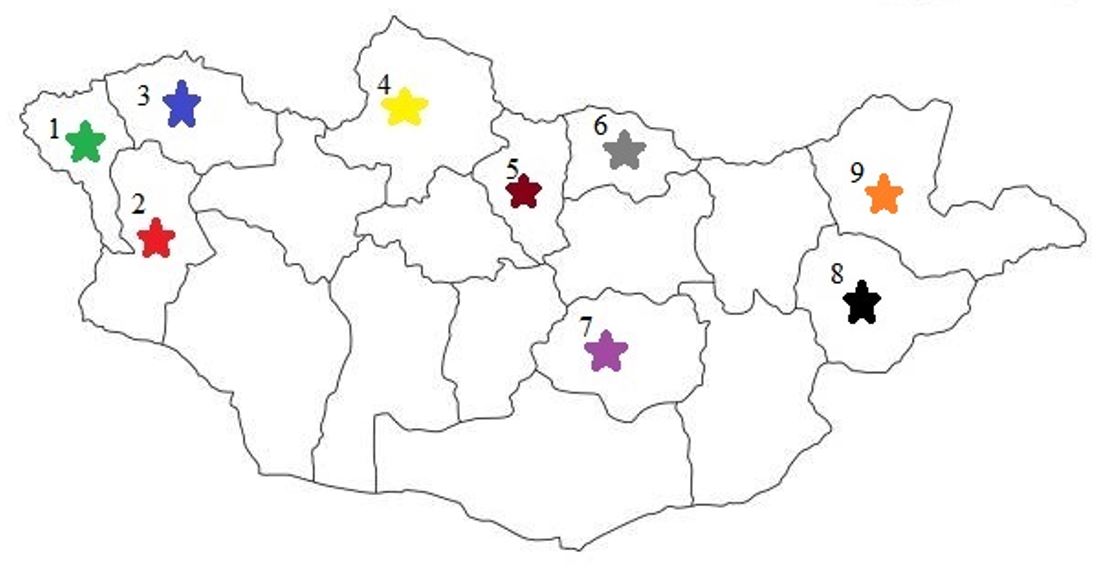
Fig. 1
Geographic distribution of nine Mongolian sheep breeds. Colors indicate breeds: Kerei (green), Torguud (red), Bayad (blue), Tsagaan-Uul (yellow), Buregkhangai (brown), Orkhon (grey), Mongol (purple), Uzemchin (black) and Barga (orange). Numbers correspond to provinces: 1, Bayan-Ulgii; 2, Khovd; 3, Uvs; 4, Khuvsgul; 5, Bulgan; 6, Selenge; 7, Dundgobi; 8, Sukhbaatar; 9, Dornod.
2.3. DNA extraction and PCR amplification
Genomic DNA was extracted from the collected blood samples using the AccuPrep Genomic DNA Extraction Kit (Bioneer) following the manufacturer’s instructions. DNA concentration and purity were measured with an ND-8000 UV-Vis spectrophotometer (NanoDrop Technologies, Wilmington, DE, USA), and further purification using a DNA precipitation method was performed to improve DNA quality and yield.
2.4. PCR amplification of ASIP gene
PCR amplification of the ASIP gene was carried out using the SimpliAmp™ Thermal Cycler (Applied Biosystems, Foster City, CA, USA) in a total reaction volume of 10 µL, containing 1 µL genomic DNA, 5 µL Quick Taq HS Dyemix, 0.5 µL of each forward and reverse primer, and nuclease-free water to adjust the volume. Primer sequences were as described by Fontanesi et al. [10]: Forward: 5’GCAGGTGGGGACATCTAGTC -3’ Reverse: 5’- CAGCAGGTGGGGTTGAGCACGCTGC -3’. The PCR conditions included an initial denaturation at 94°C for 5 minutes, followed by 40 cycles of 94°C for 45 seconds, 59°C for 45 seconds and 72°C for 45 seconds with a final extension step at 72°C for 5 minutes. The reaction was then held at 4°C. PCR products were separated by electrophoresis on 2% (w/v) agarose gel.
2.5. Genotyping of ASIP Missense Mutation by PCR-RFLP
After PCR amplification of the ASIP gene, the missense mutation (g.5172T > A, p.C126S) in exon 4, associated with black non-agouti coat color, was genotyped using the restriction enzyme PstI. Digestion reactions contained 10 µL of PCR product, 2 µL of 10X buffer, 1 µL (4 units) of PstI enzyme, and 7 µL of nuclease-free water to a final volume of 20 µL. Samples were incubated at 37°C for 12 hours. The digested fragments were separated on 2% agarose gel in 1xTBE buffer and visualized by ethidium bromide staining after electrophoresis at 80 V for 90 minutes.
2.6. PCR Amplification and RFLP of CAST Gene
The CAST gene was amplified using primers: Forward: 5'-TGGGGCCCAATGACGCCATCGATG-3', Reverse: 5'-GGTGGAGCAGCACTTCTGATCACC-3'. PCR reactions 10 µL total volume contained 6.7 µL nuclease-free water, 1 µL 10 x buffer, 0.2 µL of each primer, 0.8 µL dNTP mix, 0.1 µL Taq DNA polymerase and 1 µL genomic DNA. Thermal cycling was performed as follows: initial denaturation at 95°C for 10 minutes; 30 cycles of 95°C for 30 seconds, 56°C for 40 seconds and 72°C for 1 minute 30 seconds; followed by a final extension at 72°C for 15 minutes. Gradient PCR was performed to optimize the annealing temperature. PCR products were separated on 1% agarose gel and visualized with ethidium bromide staining. For RFLP analysis, 6 µL PCR product was mixed with 2 µL buffer, 0.5 µL MspI enzyme, and 7.5 µL nuclease-free water to a total volume of 16 µL. The mixture was incubated at 37°C for 3 hours in a water bath. Digested products were separated on 1% agarose gel and visualized by ethidium bromide staining.
2.7. Data Analysis
Allele and genotype frequencies were calculated. Hardy-Weinberg equilibrium and associations with body weight were analyzed using PopGene32 (version 1.31) and ANOVA.
2.8. Genotypic and Allele Frequencies
Genotypic frequencies were calculated using the equation:
where ni is the number of animals with genotype i, and N is the total number of animals analyzed for that gene.
Allelic frequencies were calculated using the equation:
where nAA is the number of homozygotes for allele A, nAB is the number of heterozygotes, and N is the total number of animals.
2.9. Hardy-Weinberg equilibrium
A chi-square test was performed to determine whether the populations are in Hardy-Weinberg equilibrium for both loci.
3. Results and Discussion
3.1. CAST Gene Polymorphism
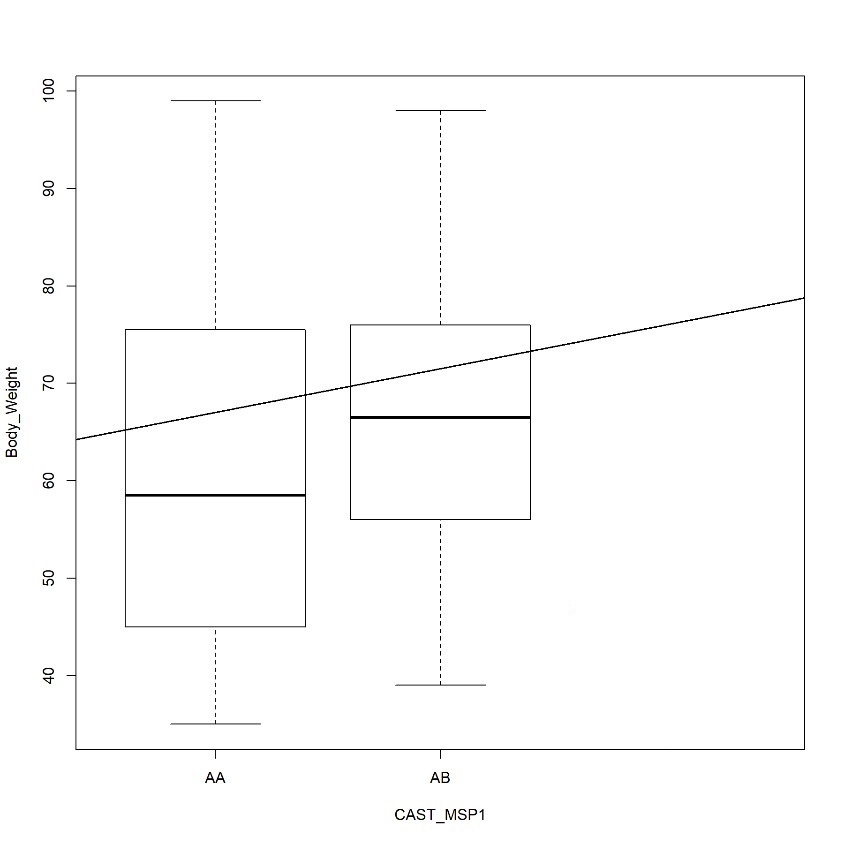
Following DNA quality control and phenotypic data selection, a final total of 120 sheep samples (comprising Mongol, Uzemchin, Barga, and Tsagaan-Uul breeds) were successfully analyzed for CAST gene polymorphism. This specific sample size, distinct from the total population in Table 1, was determined by the availability of complete growth trait records. PCR amplification produced a 622 bp fragment (Fig. 3), which was confirmed on agarose gel. Subsequent digestion with the restriction enzyme MspI revealed two alleles (A and B). Only two genotypes (AA and AB) were observed, although three are theoretically possible. Among the studied population, the AA genotype (336 bp and 286 bp fragments) was the most frequent, observed in approximately 114 individuals (94.83%). The AB genotype (622 bp, 336 bp, and 286 bp) was detected in 6 individuals (5.17%), whereas the BB genotype (622 bp) was not observed (Fig. 4 ). The results showed that allele frequencies across the four breeds were A (96.05%) and B (3.95%), with genotype frequencies of AA (94.83%), AB (5.17%), and BB (0%) (Table 2). Allele A ranged from 0.95 to 0.966, and allele B from 0.034 to 0.05. The AA genotype was most common, ranging from 90% in Uzemchin to 98% in Mongol and Tsagaan-Uul. The AB genotype varied, being highest in Uzemchin (10%) and Barga (6.7%). Chi-square tests indicated no significant deviation from Hardy-Weinberg equilibrium (p > 0.05), suggesting genetic stability of the CAST gene. One-way ANOVA was conducted to evaluate the association between CAST genotypes and body weight. The analysis revealed no significant association (p > 0.05). The mean body weight for the AA genotype (n=114) was 55.0 ± 11.9 kg, while for the AB genotype (n=6), it was 60.0 ± 10.5 kg (Fig. 5). These findings indicate that the CAST gene polymorphism is not a major factor influencing body weight in the Mongolian sheep populations studied.
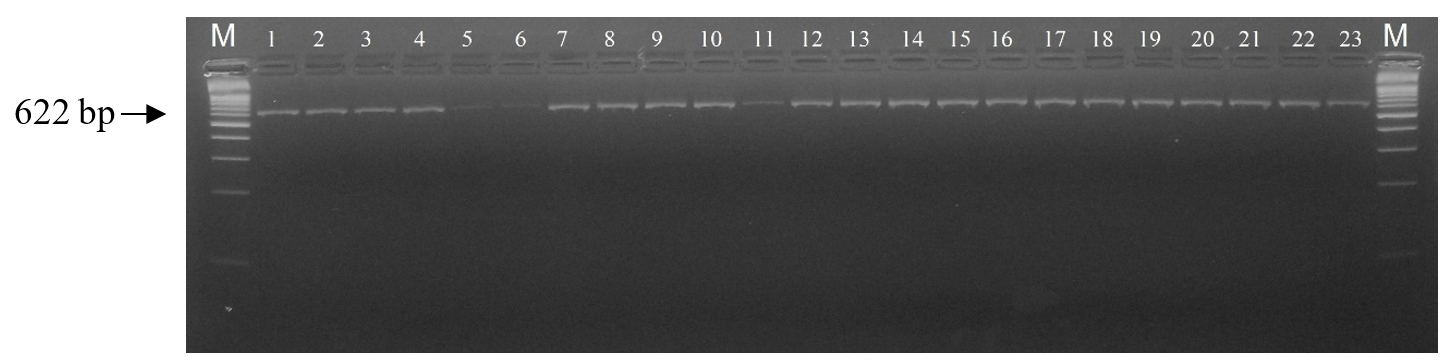
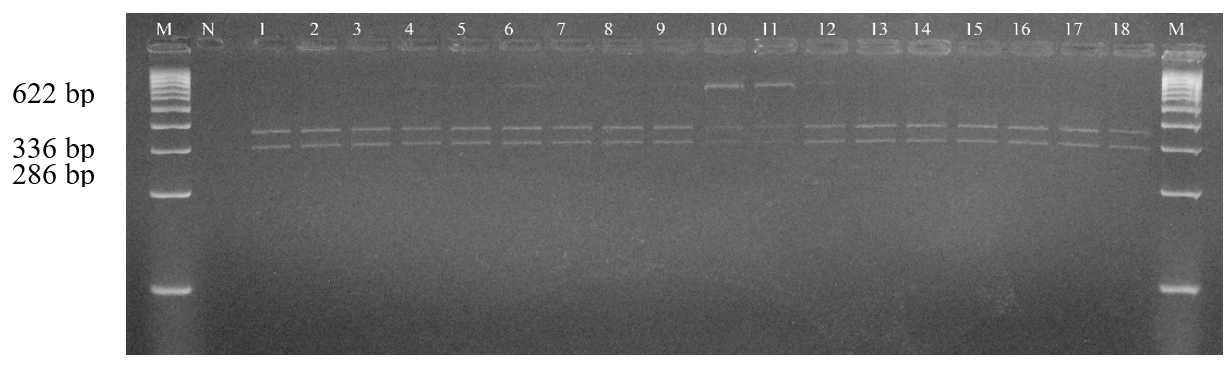
Table 2.
Allele and genotype frequencies of the Calpastatin gene
3.2. ASIP Gene polymorphism
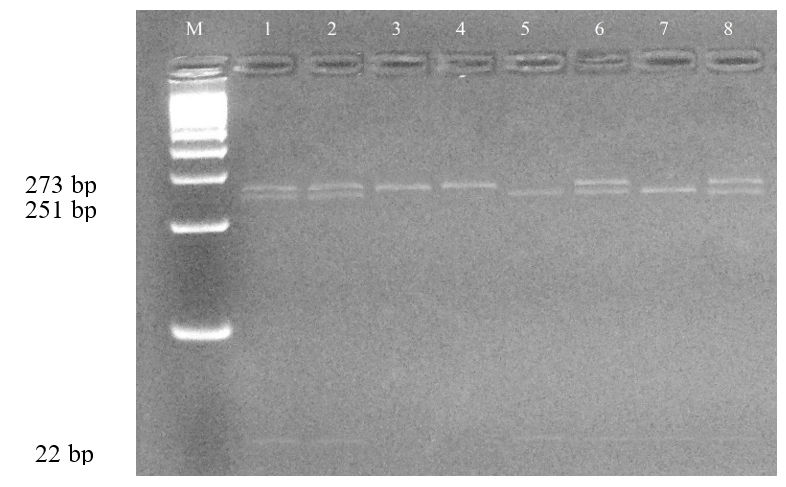
For the ASIP gene, a total of 173 sheep samples from eight breeds were successfully genotyped after excluding samples with insufficient DNA quality. PCR amplification produced a 273 bp fragment (Fig. 6), which was confirmed on agarose gel. Analysis of the ASIP gene polymorphism revealed two alleles: T (dominant) and A (recessive). The overall mean allele frequencies were T (66.2%) and A (33.8%) (Table 3). The high frequency of the T allele indicates the dominance of the white coat color trait in the sheep population. However, the A allele (colored coat) was maintained at the highest frequencies in Kerei (42.5%) and Bayad (38.2%) populations, suggesting valuable genetic reserves for colored wool. At the genotypic level, the mean frequencies were TT (47.6%), TA (42.9%), and AA (9.7%). The high prevalence of the TA (heterozygote) genotype indicates significant genetic variability within the ASIP locus. All eight populations were confirmed to be in Hardy-Weinberg Equilibrium (HWE) with p > 0.05 (Fig. 7), implying genetic stability and a system of random mating regarding the ASIP locus in these indigenous sheep breeds. These data are crucial for establishing future breeding programs focused on managing coat color traits and conserving the genetic pool for colored wool production.
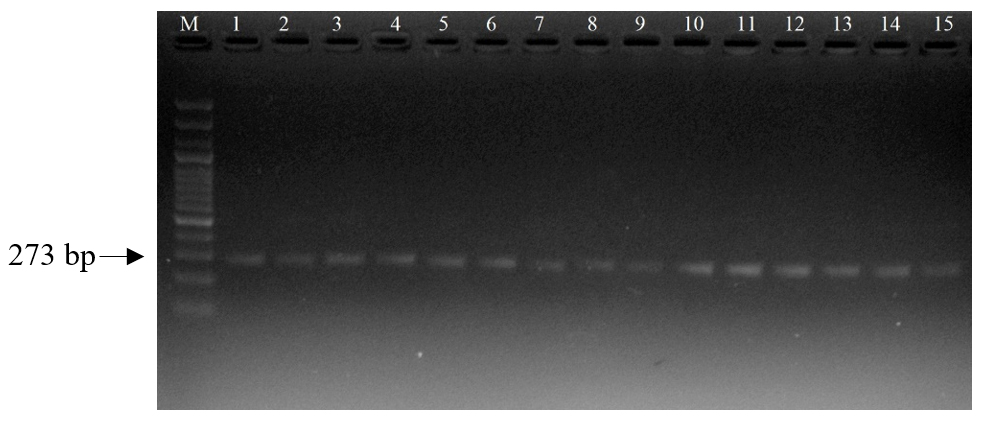
Table 3.
Allele and genotype frequencies of the ASIP gene
4. Conclusions
This study represents the first molecular characterization of polymorphisms in the ASIP and CAST genes in several Mongolian sheep breeds using the PCR-RFLP technique. The CAST gene showed low genetic variability, with a high predominance of the A allele and the AA genotype across all analyzed populations, and no significant association was observed between CAST genotypes and body weight. These findings suggest that the investigated CAST polymorphism does not directly influence growth traits in the studied sheep populations. Polymorphism of the ASIP gene was also identified, providing preliminary genetic information related to coat color variation in Mongolian sheep. Although combined analysis of both genes in the same individuals was limited by breed-specific sampling, the results provide important baseline data on genetic diversity in native Mongolian sheep. This information may contribute to future marker-assisted selection strategies and conservation-based breeding programs aimed at improving economically important traits while preserving indigenous genetic resources.
